Car Fire Statistics: How Many, What Causes Them and Which Cars
About 196,000 highway vehicles catch fire in the US each year. NFPA’s national figures plus NHTSA data: fire complaints by model, fire-risk recalls, EVs vs gas cars and what to do.
Key takeaways
- US fire departments responded to about 196,000 highway vehicle fires a year in 2018–2022. These fires killed about 579 people and injured 1,336 each year, according to the National Fire Protection Association (NFPA).
- Most vehicle fires start with a mechanical or electrical failure, but crashes cause a disproportionate share of the deaths. NFPA found that half of passenger-car fire deaths involved a factor such as a collision or overturn.
- Of the 1,526,926 safety complaints owners have filed with NHTSA, 38,350 report a fire (2.5%). The share has fallen from 3.6% for 1995–1999 models to 1.0% for the latest full five-year group.
- 4,623 vehicle recalls in NHTSA’s file name a fire risk, about one in six of all recalls. Fire complaints often cluster on the vehicles that are later recalled.
- Electric models show a lower share of fire complaints than gas cars, SUVs and pickups of the same years: 0.7% against 1.1%.
About 196,000 highway vehicles catch fire in the US each year, roughly one of every seven fires that fire departments attend, and those fires kill about 580 people a year. This page brings together the national fire statistics from the NFPA with what NHTSA’s own files show: the fires owners report in safety complaints, the models with the most fire reports, the recalls issued for fire risk, and how electric vehicles compare.
How many car fires are there each year?
The best national estimate comes from the NFPA, which projects fire department reports to national totals. Its latest vehicle fire report, published November 2024, covers 2018–2022:
| Type | Fires a year | Civilian deaths | Civilian injuries |
|---|---|---|---|
| All vehicle fires | 215,096 | 643 | 1,532 |
| Highway vehicles (cars, trucks, buses, motorcycles, RVs) | 195,927 | 579 | 1,336 |
| Passenger vehicles | 119,681 | 380 | 783 |
| Large trucks | 15,462 | 46 | 102 |
| Buses | 1,075 | 2 | 8 |
Source: NFPA, Vehicle Fires (Tucker McGree, November 2024), national estimates from fire department reports.
Vehicle fires made up 16% of all fires reported in the US over those years. The NFPA puts it starkly:
“From 2018–2022, only fires in one- and two-family homes caused more estimated civilian deaths than vehicle fires.”National Fire Protection Association, Vehicle Fires, 2024
The long-term trend is down. NFPA reports highway vehicle fires in 2022 were 69% below 2005, and fires per billion miles driven have fallen over the same period. Deaths have moved the other way: they have risen most years since 2016, with about 650 in 2022. Fires peak in summer, especially July, and between 3 and 7 p.m., while fire deaths peak late at night.
What causes car fires
NFPA’s analysis of fire department reports points to a few clear patterns:
- Mechanical or electrical failure is the leading factor in highway vehicle fires, including 44% of large truck fires and 38% of bus fires.
- Where they start: most fires begin in the engine area, running gear or wheel area. Fires that start near the fuel tank or fuel line, or in the passenger area, cause a disproportionate share of deaths.
- What burns first: the two most common items first ignited are electrical wire or cable insulation and flammable liquid or gas in or from the engine. Fires that start with a flammable liquid or gas account for about half the deaths.
- Crashes: for passenger cars, an “operational deficiency” such as a collision or overturn was a factor in only 7% of fires but 50% of fire deaths.
- Age: about three-quarters of the 2022 highway vehicle fires caused by mechanical or electrical failures involved vehicles from the 2011 model year or earlier.
Recall campaigns tell the same story from the manufacturing side: the components most often named in fire-risk recalls are electrical systems, equipment, fuel systems and engines, as the table below shows.
Fires in owner complaints to NHTSA
Every owner complaint to NHTSA records whether a fire was involved. Across the complaint file:
| Model years | Complaints | Reporting a fire | Share |
|---|---|---|---|
| 1995–1999 | 198,560 | 7,050 | 3.6% |
| 2000–2004 | 271,572 | 8,272 | 3.0% |
| 2005–2009 | 314,265 | 5,583 | 1.8% |
| 2010–2014 | 269,547 | 5,238 | 1.9% |
| 2015–2019 | 238,326 | 3,296 | 1.4% |
| 2020–2024 | 116,183 | 1,216 | 1.0% |
| 2025–2027 | 12,989 | 99 | 0.8% |
Complaints for recent model years are still coming in. Source: NHTSA owner complaints file, retrieved Oct 6, 2026; computed by PlainVIN.
The falling share fits the NFPA trend: newer vehicles are less likely to catch fire, and much of the fire risk sits in older cars. Recent model years will still gain complaints, but their fire share has been low from the start. Our guide to filing a complaint with NHTSA explains how to report a fire or a near miss, and our analysis of the most common car problems covers what else owners report.
Which cars catch fire the most?
No public national dataset gives a fire rate per vehicle for each model. What NHTSA’s complaint file does show is which models have drawn the most owner reports of fire:
| Model | Model years with fire reports | Fire complaints | Share of the model’s complaints |
|---|---|---|---|
| Ford F-150 | 1982–2025 | 2,093 | 5.4% |
| Pontiac Grand Prix | 1984–2008 | 835 | 15.4% |
| Ford Explorer | 1990–2024 | 794 | 2.3% |
| Ford Expedition | 1996–2025 | 710 | 7.6% |
| Jeep Grand Cherokee | 1988–2023 | 627 | 2.1% |
| Ford Taurus | 1986–2018 | 570 | 3.1% |
| Jeep Wrangler | 1987–2025 | 545 | 3.0% |
| Hyundai Sonata | 1989–2022 | 524 | 3.3% |
| Ford Escape | 2001–2023 | 522 | 1.9% |
| Ford Escort | 1982–2002 | 475 | 12.1% |
| Lincoln Town Car | 1983–2010 | 443 | 13.4% |
| Ford Aerostar | 1986–1998 | 440 | 19.0% |
| Ford Windstar | 1985–2004 | 428 | 3.0% |
| Toyota Camry | 1985–2023 | 420 | 2.3% |
| Kia Sorento | 2003–2024 | 414 | 4.1% |
Counts of owner complaints to NHTSA that report a fire, for models with at least 500 complaints. These are reports, not verified fires or rates: models that sold in larger numbers draw more complaints. Source: NHTSA owner complaints file, retrieved Oct 6, 2026; computed by PlainVIN.
Read this as a list of where owners have reported fires, not a ranking of the most dangerous cars: popular models like the F-150 draw more complaints of every kind. The share column helps. A model where fires make up a high share of its complaints stands out even if its total is modest.
The fire reports often line up with recalls filed later:
- Ford F-150, around 2000: the 1997, 2000 and 2001 F-150 drew more fire complaints than any other model years in the file, with the 2000 Expedition close behind. Ford later recalled millions of vehicles because the cruise-control deactivation switch could overheat and catch fire, including campaigns 05V017 and 05V388 in 2005. See the Ford F-150 by year.
- Pontiac Grand Prix, about 1997–2001: fires are about 15% of its complaints. GM issued underhood and engine-compartment fire recalls in 2008 and 2009, and an oil-on-exhaust-manifold fire recall in 2015.
- Kia Optima and Hyundai Sonata, early 2010s: later covered by fuel-pipe and anti-lock brake control unit (HECU) recalls that warned of fire. The largest, campaign 23V652 in 2023, covered about 1.7 million Kia vehicles. See our Park Outside recall list for the Hyundai and Kia ABS module fires.
Fire-risk recalls
We counted every vehicle recall whose NHTSA title, summary or consequence names a fire risk:
| Component | Campaigns | Vehicles | Share of vehicles |
|---|---|---|---|
| Electrical | 673 | 12,437,821 | 24% |
| Equipment | 381 | 3,175,898 | 6% |
| Fuel system | 334 | 5,664,516 | 11% |
| Engine | 170 | 11,825,257 | 23% |
| Brake | 86 | 8,057,400 | 16% |
| Power train | 55 | 1,013,995 | 2% |
| Fuel pump | 40 | 2,169,348 | 4% |
| Steering | 27 | 1,155,063 | 2% |
Grouped by the first component NHTSA lists. Source: NHTSA recalls file, retrieved Oct 6, 2026; computed by PlainVIN.
| Automaker | Campaigns | Vehicles potentially affected | Repaired (vehicle-weighted) | Est. not yet repaired |
|---|---|---|---|---|
| Ford | 95 | 7,325,019 | 78% | 1,217,226 |
| Kia | 47 | 6,757,780 | 55% | 2,852,715 |
| Hyundai | 51 | 6,572,588 | 63% | 2,304,008 |
| Stellantis (FCA US) | 51 | 4,924,091 | 69% | 1,097,796 |
| BMW | 57 | 4,288,990 | 48% | 2,216,354 |
| Honda | 25 | 3,259,862 | 82% | 590,883 |
| Volkswagen Group | 64 | 3,087,332 | 78% | 664,954 |
| General Motors | 39 | 2,894,162 | 84% | 460,932 |
| Toyota | 14 | 2,665,740 | 54% | 1,207,393 |
| Nissan | 24 | 2,564,756 | 68% | 819,901 |
“Repaired” weights each campaign’s reported completion rate by its vehicle count; “not yet repaired” is the matching estimate. A vehicle in several campaigns is counted in each. Source: NHTSA recalls file and US DOT completion data, retrieved Oct 6, 2026; computed by PlainVIN.
Some of the largest repair gaps are in fire recalls, because many cover older cars. The biggest fire-risk recalls filed this year, in NHTSA’s wording:
| Filed | Vehicles (NHTSA wording) | Problem | Units | Repaired |
|---|---|---|---|---|
| Jun 2026 26V363000 | Certain 2021-2025 Jeep Wrangler, Wrangler 4XE, and Jeep Gladiator vehicles | Power Steering Wiring May Catch Fire | 1,076,999 | – |
| Jul 2026 26V468000 | Certain 2021-2026 Bronco and Bronco Raptor vehicles | Engine Compartment Fire | 565,691 | – |
| Jul 2026 26V430000 | Certain 2020-2024 Telluride vehicles | Fire from Overheated Power Seat Motors | 462,869 | – |
| Feb 2026 26V080000 | Certain 2023-2025 Rogue vehicles equipped with 3-cylinder 1.5L variable compression turbo (VC-Turbo) engines | Engine Failure | 323,917 | 70% |
| Sep 2026 26V578000 | Certain 2023-2027 F-150 vehicles | Fuel Tank May Leak or Detach | 223,472 | – |
| Apr 2026 26V232000 | Certain 2022-2026 Carnival vehicles | Fuel Leak at Pipe Connection | 141,032 | 8% |
| Apr 2026 26V238000 | Certain 2024-2026 Ranger vehicles | Sun Visor Wiring May Cause Fire | 140,201 | – |
| Jan 2026 26V011000 | Certain 2013-2018 Focus, 2013-2019 Escape, and 2015-2016 MKC vehicles equipped with a 2.0L engine | Engine Block Heater May Short Circuit and Cause Fire | 116,672 | – |
| Apr 2026 26V229000 | Certain Genesis 2022-2026 GV70, 2023-2025 G90, 2021-2025 G80, and GV80 vehicles | Fuel Leak at Pipe Connection | 94,760 | – |
| Jan 2026 26V056000 | Certain 2021-2023 Toyota Supra, 2022-2023 2 Series Coupe, 2021-2024 5 Series (xDrive), 2021-2022 Z4, 2022-2024 4 Series (Gran Coupe) and others | Starter Motor May Overheat and Cause a Fire | 87,394 | 32% |
Vehicle descriptions are NHTSA’s own summary wording; “repaired” is the share the manufacturer reports as fixed, and new campaigns start near zero. Source: NHTSA recalls file and US DOT completion data, retrieved Oct 6, 2026.
The most serious fire recalls tell owners to park outside until the repair is done; our Park Outside list covers every one. For year-by-year totals across all recalls, see our car recall statistics.
Do electric cars catch fire more than gas cars?
The evidence points the other way, though good data is thin. In NHTSA’s complaint file, a smaller share of complaints about electric models report a fire than complaints about gas and hybrid vehicles of the same years:
| Vehicle type | Complaints | Reporting a fire | Share |
|---|---|---|---|
| Vans | 1,720 | 41 | 2.4% |
| Pickups | 46,663 | 588 | 1.3% |
| Cars (gas and hybrid) | 48,500 | 537 | 1.1% |
| SUVs | 136,659 | 1,479 | 1.1% |
| Minivans | 9,946 | 76 | 0.8% |
| Electric (battery-electric models) | 22,042 | 160 | 0.7% |
Share of each group’s owner complaints that report a fire; it is not a fire rate per vehicle. SUVs, pickups and vans exclude electric models. Source: NHTSA owner complaints file, retrieved Oct 6, 2026; computed by PlainVIN.
That is a share of complaints, not a fire rate per vehicle, so it can’t say how likely any car is to burn. A widely repeated estimate, about 1,530 fires per 100,000 gasoline cars sold against 25 per 100,000 battery-electric vehicles, comes from a study citing National Transportation Safety Board and Bureau of Transportation Statistics data, as IEEE Spectrum reported. It compares fires with vehicles sold rather than vehicles on the road, so treat it as a rough comparison.
Where EVs differ is in how damaged batteries are handled: NHTSA tells owners of flooded electric or hybrid vehicles to keep them at least 50 feet from buildings, other vehicles and anything that can burn (see our flood-damaged car guide). Battery recalls are a small but serious part of EV recalls; our EV recall analysis lists them.
What to do if your car catches fire
The U.S. Fire Administration’s advice is short and worth memorizing:
- Pull over as quickly as it is safe to do so, and turn off the engine.
- Get everyone out and never go back into a burning vehicle. Don’t try to fight the fire yourself.
- Don’t open the hood or trunk if you think the fire is under it; the extra air can make it grow.
- Move at least 100 feet away and well away from traffic.
- Call 911.
Source: U.S. Fire Administration, Vehicle Fire Safety. This guide is general safety information, not professional advice.
How to lower your car’s fire risk
- Check for open recalls by VIN at nhtsa.gov/recalls, and act on any fire-risk recall at once; the repair is free. Our guide shows where to find the VIN.
- Get regular service. Leaks of oil, fuel or coolant and worn wiring are common starting points.
- Respond to warning signs at once: NFPA’s advice is to act immediately if you see smoke or flames or smell burning rubber or plastic. Have fluid leaks under the car checked promptly.
- Carry fuel and propane safely, sealed and upright, away from passengers, as USFA advises.
- Buying used? Check the VIN for open recalls and owner complaints for that model year, and follow our used car inspection checklist.
National fire figures are NFPA estimates for 2018–2022. Complaint and recall figures are PlainVIN’s analysis of NHTSA’s files and update when we refresh the data; complaint counts are owner reports, not verified fires or rates.
Frequently asked questions
How common are car fires?
Very common: US fire departments responded to an estimated 195,927 highway vehicle fires a year in 2018–2022, about 14% of all reported fires, according to the NFPA. Passenger vehicles accounted for about 119,681 of them a year.
How many people die in car fires each year?
About 579 people a year died in highway vehicle fires in 2018–2022, with about 650 in 2022, according to NFPA estimates. Half of passenger-car fire deaths involved a factor such as a collision or overturn.
What is the most common cause of car fires?
Mechanical or electrical failure is the leading factor, and most fires start in the engine area, running gear or wheel area. Leaking fuel or oil and damaged wiring are typical starting points.
Which cars catch fire the most?
No public dataset gives a fire rate for every model. In NHTSA’s complaint file, the Ford F-150, Pontiac Grand Prix, Ford Explorer and Ford Expedition have the most owner reports of fire, and several were later recalled for fire risk. Counts reflect how many were sold, too.
Do electric cars catch fire more than gas cars?
The available evidence says no. In NHTSA’s complaint file, a smaller share of complaints about electric models report a fire than for gas cars of the same years. Damaged EV batteries need special handling, so follow NHTSA’s advice after a flood or crash.
What should I do if my car catches fire?
Pull over when safe, turn off the engine, get everyone out, don’t open the hood or trunk, move at least 100 feet away and call 911. Never go back into a burning vehicle.
How do I know if my car has a fire-risk recall?
Enter the VIN at nhtsa.gov/recalls. Fire-risk recall repairs are free, and some come with a warning to park outside until the repair is done.
About the PlainVIN Recalls & Safety Desk
This desk covers recall campaigns and completion rates, owner complaints filed with NHTSA, and NHTSA 5-Star Safety Ratings.
Every figure in this guide links to its primary source. See our editorial policy, how we use AI and corrections log.
How this page was madeSources, processing, limits, review and changes
Data sources
- NFPA, Vehicle Fires (Tucker McGree, Nov 2024)
nfpa.org, read Oct 8, 2026 - U.S. Fire Administration, Vehicle Fire Safety
usfa.fema.gov, read Oct 8, 2026 - NHTSA owner complaints file (fire flag) and recalls file
Retrieved Oct 6, 2026 - IEEE Spectrum, Extinguishing the EV Battery Fire Hype (Dec 2023)
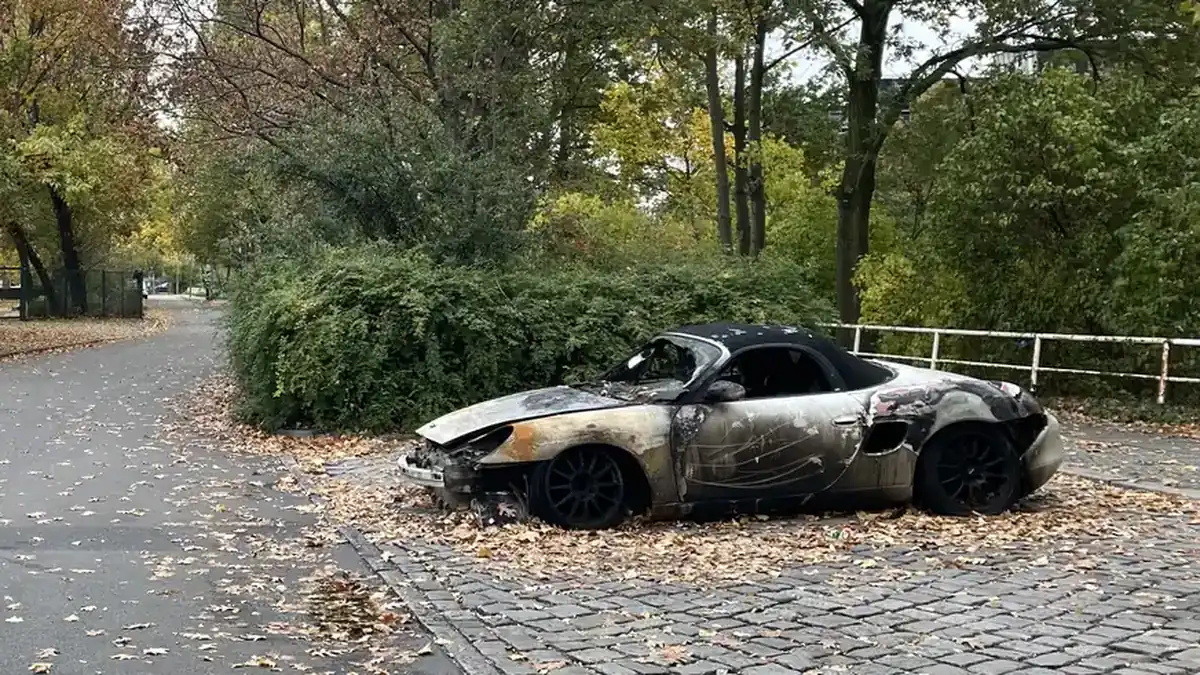
spectrum.ieee.org, read Oct 8, 2026 - Burned-out car photo (CC0)
Wikimedia Commons, GanzKnusper

Processing
- Complaints are counted per component. One complaint can list several, so component totals add up to more than the total.
- Fuel cost = miles per year ÷ EPA combined mpg × EIA weekly price for your region.
Limitations
- Complaint counts are owner reports, not verified findings or failure rates. There is no sales denominator.
- Recall campaigns are listed for the model year. Only NHTSA and the automaker know whether a specific car was repaired.
- Recent model years are still collecting reports.
Review
Written and checked against primary sources by the Recalls & Safety desk.
Changelog
- 2026-10-06 Data refreshed from the official files.
Keep reading