Most Common Car Problems, According to 1.5 Million Owner Complaints
What owners actually report to NHTSA: the most common car problems by system, how they’re changing as cars add driver-assist tech, and how they differ for sedans, SUVs, pickups and EVs.
Key takeaways
- Across 1,526,926 safety complaints owners filed with NHTSA, the most-reported systems are electrical, powertrain (transmission and driveline), brakes, engine and air bags.
- The mix is changing: for 2018-and-newer models, 8.7% of complaints involve automatic emergency braking and forward-collision systems, almost unheard of in older cars. Air bag complaints fell from 13.5% to 3.5%.
- Problems differ by vehicle type: brakes top the list for pickups, and electrical problems dominate in electric vehicles.
- The typical complaint is filed at around 67,000 miles, so most problems show up well before a car is old. Check what owners report for your exact model year before you buy.
The most common car problems owners report to federal safety regulators involve the electrical system, the powertrain, brakes, the engine and air bags. That’s from our analysis of every owner complaint in NHTSA’s database. This guide shows which problems lead, how the list is changing as cars add driver-assistance technology, how it differs between sedans, SUVs, pickups and EVs, and how to check the problems reported for your own car.
The most common problems owners report
Most lists of common car problems come from repair shops and cover routine wear, such as batteries, brake pads and tires. NHTSA’s complaint database is different: it records problems owners believe are safety-related, filed by owners themselves, for every make and model. That makes it the largest public record of what actually goes wrong. In the file we track, owners have reported 91,837 crashes and 38,350 fires.
| Component (NHTSA category) | Complaints naming it | Share |
|---|---|---|
| Electrical System | 233,687 | 15% |
| Power Train | 205,661 | 13% |
| Service Brakes | 171,330 | 11% |
| Engine | 166,878 | 11% |
| Air Bags | 151,105 | 10% |
| Steering | 137,918 | 9% |
| Unknown Or Other | 112,354 | 7% |
| Engine And Engine Cooling | 106,674 | 7% |
| Structure | 94,860 | 6% |
| Vehicle Speed Control | 81,456 | 5% |
A complaint can name more than one component, so shares add up to more than 100%. “Unknown or other” is NHTSA’s own category. Source: NHTSA ODI complaints file, retrieved Oct 6, 2026; computed by PlainVIN.
The categories are broad. “Electrical system” ranges from a dead instrument panel to failed window switches and battery drain. “Powertrain” covers transmissions that slip, shift harshly or lose drive. “Engine” includes stalling, oil consumption and failures; older complaints used the label “engine and engine cooling.” Each PlainVIN model-year report breaks these down for a specific car.
How car problems are changing
Comparing complaints by the vehicles’ model years shows how the problems follow the technology. Newer cars have far more electronics and driver-assistance systems, and the complaints reflect it:
| Component | 2000–09 | 2010–17 | 2018–26 |
|---|---|---|---|
| Electrical System | 14.9% | 16.6% | 20.4% |
| Engine | 5.9% | 20.6% | 20.4% |
| Powertrain (transmission, driveline) | 12.3% | 15.6% | 15.3% |
| Brakes | 10.4% | 9.0% | 10.2% |
| Steering | 9.2% | 11.4% | 8.1% |
| Air Bags | 13.5% | 10.6% | 3.5% |
| Forward collision avoidance (automatic braking) | 0% | 0.7% | 8.7% |
| Speed control (cruise, unintended acceleration) | 5.8% | 5.0% | 4.5% |
| Lane departure and lane keeping | 0% | 0.3% | 2.6% |
| Backup camera and rear visibility | 0% | 0.6% | 2.4% |
| Complaints in the group | 585,837 | 421,090 | 215,911 |
A complaint can name more than one component. NHTSA renamed some categories over time (for example “Engine and engine cooling” became “Engine”), so compare related rows together. Source: NHTSA ODI complaints file, retrieved Oct 6, 2026; computed by PlainVIN.
- Driver-assistance complaints are new. Forward collision avoidance, which includes automatic emergency braking, accounts for 8.7% of complaints about 2018-and-newer models, often describing the car braking hard for no reason. Lane-keeping and backup-camera complaints are rising too.
- Electrical complaints keep growing, from 14.9% for 2000s models to 20.4% for the newest.
- Air bag complaints have fallen sharply, from 13.5% to 3.5%. Older cars still carry the risk of recalled inflators: see our Takata air bag recall guide.
One caution when comparing years: complaints keep arriving for years after a model goes on sale, so recent model years always look better than they will. Our guide to NHTSA complaints explains that reporting lag.
Common problems by vehicle type
The most-reported problems differ by the kind of vehicle:
| Vehicle type | Complaints | Top three components (share of complaints) |
|---|---|---|
| Sedan | 577,928 | Electrical System 15% · Powertrain (transmission, driveline) 13% · Air Bags 12% |
| SUV | 549,626 | Electrical System 16% · Engine 15% · Powertrain (transmission, driveline) 14% |
| Pickup | 209,598 | Brakes 16% · Powertrain (transmission, driveline) 15% · Electrical System 11% |
| Minivan | 103,351 | Electrical System 19% · Powertrain (transmission, driveline) 15% · Brakes 12% |
| Coupe | 48,700 | Air Bags 14% · Electrical System 14% · Powertrain (transmission, driveline) 12% |
| Wagon | 14,069 | Air Bags 22% · Electrical System 15% · Powertrain (transmission, driveline) 12% |
| Electric | 12,779 | Electrical System 35% · Forward collision avoidance (automatic braking) 20% · Brakes 10% |
| Van | 10,875 | Brakes 15% · Electrical System 15% · Powertrain (transmission, driveline) 12% |
Excludes NHTSA’s “unknown or other” category. Vehicle type is PlainVIN’s classification of each model. Source: NHTSA ODI complaints file, retrieved Oct 6, 2026; computed by PlainVIN.
Brakes top the list for pickups and tie for first in vans. For minivans, NHTSA’s structure category (the body itself) ranks in the top four. Electric vehicles show the newest pattern: electrical systems and forward collision avoidance lead by a wide margin. See the reports for popular models such as the Ford F-150, Toyota Camry, Honda CR-V and Tesla Model 3.
Warning signs worth acting on
Many safety complaints describe a warning sign the owner noticed first. These are the ones not to ignore, grouped by the systems that lead the complaint data:
| System | Warning signs | What to do |
|---|---|---|
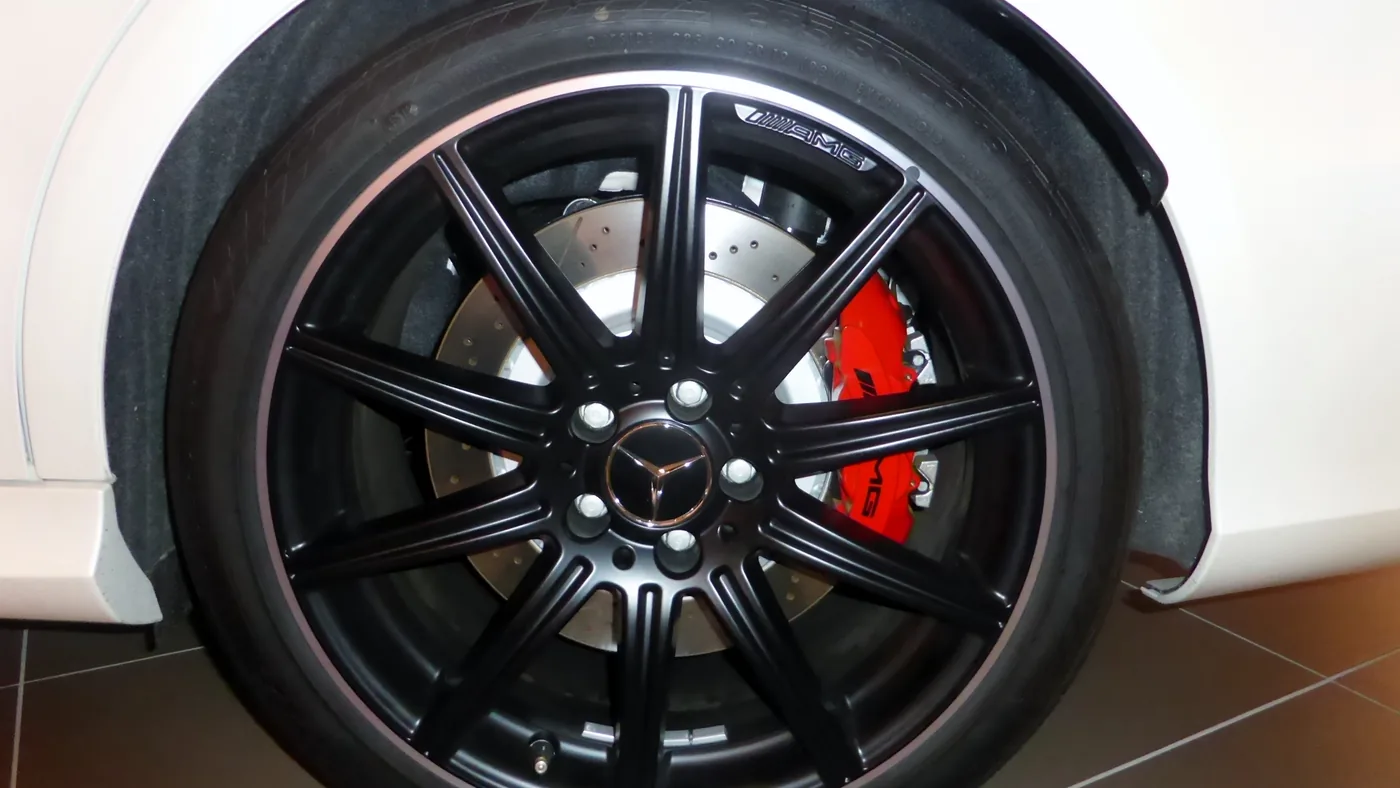
| Brakes | Soft or sinking pedal, grinding, pulling to one side, brake warning light | Stop driving if the pedal sinks; get it inspected right away |
| Powertrain | Slipping, delayed or harsh shifts, sudden loss of drive | Check for recalls and service bulletins; have it diagnosed before a long trip |
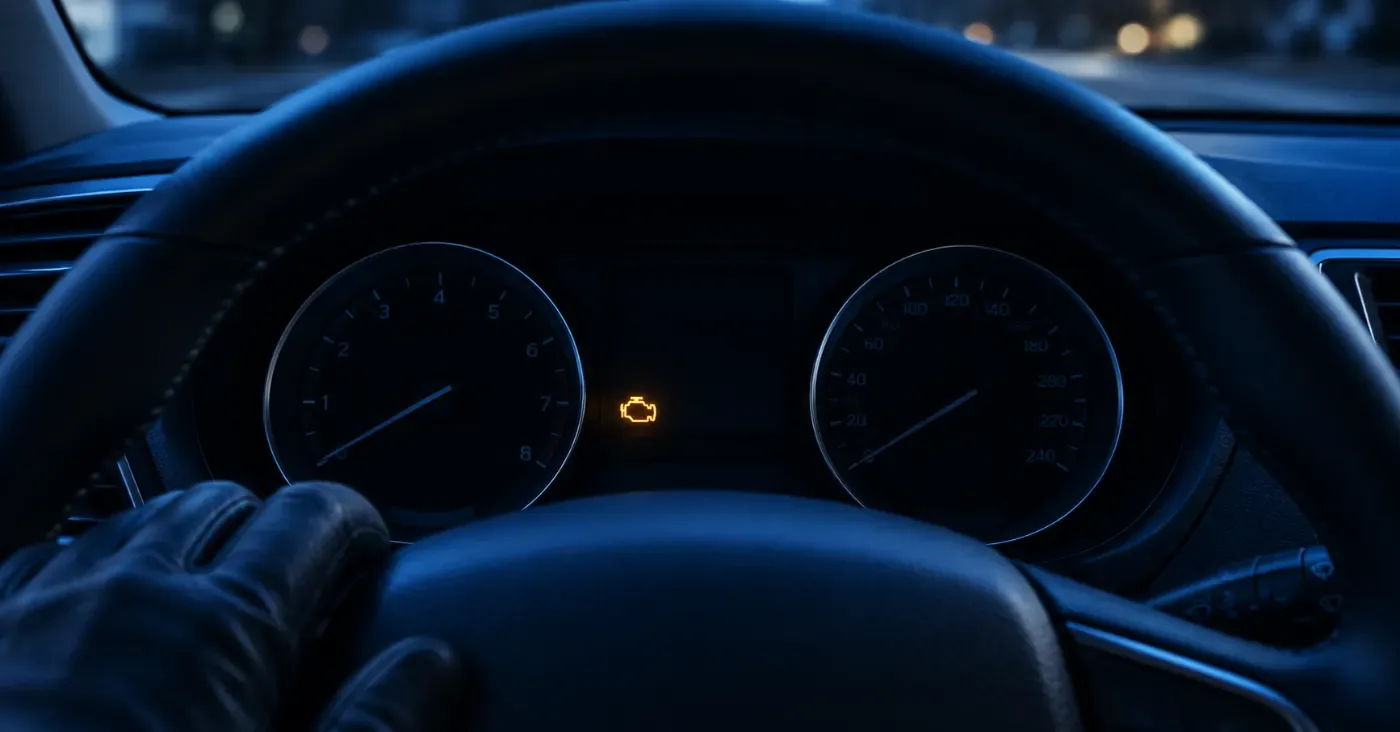
| Engine | Flashing check-engine light, stalling, overheating, burning smell | A flashing light signals a serious misfire: slow down and get it checked promptly; a stall at speed is worth reporting |
| Electrical | Flickering dash, warning lights that come and go, battery drain, smoke | Smoke or burning smell: park outside and get help |
| Driver assistance | Hard braking with nothing ahead, steering tugging in a lane | Note the conditions, check for software updates, and report it |
| Air bags | Air bag warning light stays on | Check for open recalls; the system may not deploy |
If a problem could affect safety, it’s worth reporting even after it’s fixed. NHTSA draws the line clearly:
“An example of a safety-related defect is a steering component that breaks, causing a driver to lose control. However, paint quality or cosmetic blemishes are not considered safety-related defects.”National Highway Traffic Safety Administration, Report a Safety Problem
Everyday problems vs. safety defects
Repair-shop lists of common car problems, such as AAA’s (AAA), focus on routine issues: the check-engine light, overheating, fluid leaks, dead batteries, worn brakes and uneven tire wear. Most of these come from normal wear and maintenance, and the fix is regular service. A safety defect is different: a design or manufacturing fault shared by many vehicles of the same model, which can lead to a recall. A brake pad that wears out at 40,000 miles is maintenance; a brake booster that fails on hundreds of cars of the same model year is a defect.
The two overlap when a common problem turns out to be a pattern. That is exactly what NHTSA watches for in complaints, and why checking your model year’s complaint list can tell you whether your problem is unusual or widely reported. When it is a known defect, there may already be a recall that fixes it free.
How to find the common problems for your car
- Decode the VIN with our VIN decoder to open the report for your exact model year.
- Read the complaint breakdown. Each report counts NHTSA complaints by component, so you can see whether owners mostly report transmission, electrical or brake problems.
- Compare model years on the model’s best and worst years page (Honda Accord shown), which ranks years by complaints and recalls.
- Check recalls for that model year, and run the VIN on NHTSA to see whether any are still open.
If you’re shopping used, our free VIN check vs. history report guide covers the other checks worth doing before you buy.
Complaint counts are owner reports, not verified findings, and they depend on how many vehicles were sold and how old they are. Use them to spot patterns, not to rank brands.
Frequently asked questions
What is the most common car problem?
In NHTSA’s owner complaint database, the electrical system is named most often, followed by the powertrain (transmission and driveline), brakes, engine and air bags. In repair-shop terms, the most frequent everyday issues are batteries, brakes and check-engine lights.
What problems do newer cars have most?
For 2018-and-newer models, electrical and engine complaints lead, and driver-assistance systems have become a major category: forward collision avoidance, including automatic emergency braking, now accounts for several percent of complaints, often describing unexpected hard braking.
Do electric cars have fewer problems?
They have different ones. EV complaints in NHTSA’s data are dominated by the electrical system and forward collision avoidance, while engine and transmission complaints, common in gas cars, largely disappear. Compare a specific EV model year rather than EVs as a group.
At what mileage do car problems usually start?
The typical complaint in NHTSA’s file is filed at around the mileage shown above, roughly 67,000 miles, but problems can appear at any age. Check the complaints for your model year to see when owners typically report them.
Which car problems are safety defects?
A safety defect is a fault shared by many vehicles of the same design that creates a safety risk, such as brakes, steering, air bags or stalling. Cosmetic issues and normal wear are not. Safety defects can lead to a free recall repair.
How do I find common problems for my car?
Decode your VIN on PlainVIN to open your model-year report, which counts NHTSA owner complaints by component and lists recalls. Then check the VIN on nhtsa.gov/recalls for any open recalls.
Should I report a car problem to NHTSA?
Yes, if it could affect safety. NHTSA uses owner complaints to spot defect patterns, which can lead to investigations and recalls. You can file online at nhtsa.gov or call 888-327-4236.
About the PlainVIN Vehicle Data Desk
This desk covers the VIN decoder and VIN guides, factory specs from NHTSA vPIC, EPA fuel-economy data, EIA fuel prices and the import of every official dataset.
Every figure in this guide links to its primary source. See our editorial policy, how we use AI and corrections log.
How this page was madeSources, processing, limits, review and changes
Data sources
- NHTSA ODI owner complaints file
Retrieved Oct 6, 2026 - Report a Safety Problem (safety-defect definition)
NHTSA, read Oct 7, 2026 - 13 Common Car Problems Explained
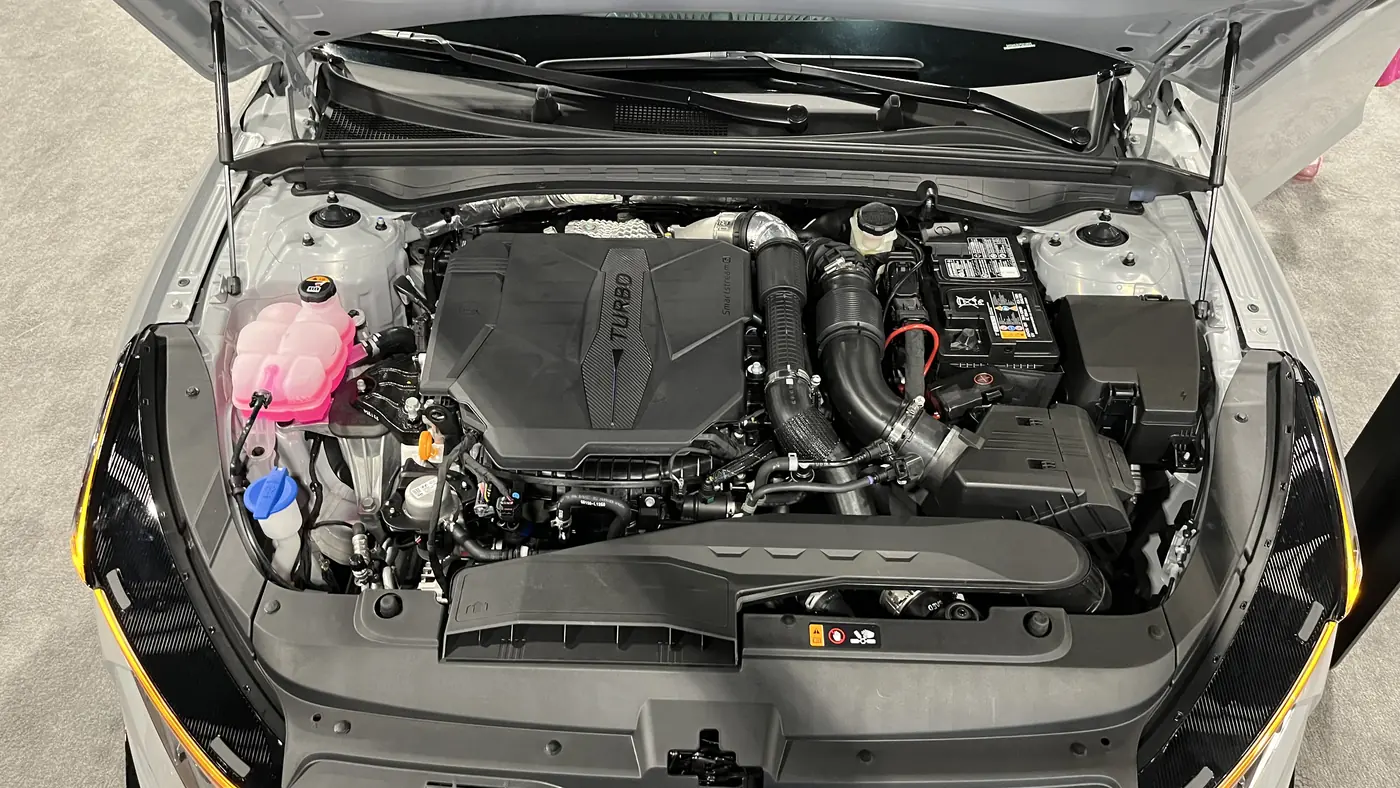
AAA, read Oct 7, 2026 - Engine bay photo (CC0)
Corqe via Wikimedia Commons - Wheel and brake photo (CC0)
Tokumeigakarinoaoshima via Wikimedia Commons

.jpg)
Processing
- Complaints are counted per component. One complaint can list several, so component totals add up to more than the total.
- Fuel cost = miles per year ÷ EPA combined mpg × EIA weekly price for your region.
Limitations
- Complaint counts are owner reports, not verified findings or failure rates. There is no sales denominator.
- Recall campaigns are listed for the model year. Only NHTSA and the automaker know whether a specific car was repaired.
- Recent model years are still collecting reports.
Review
Written and checked against primary sources by the Vehicle Data desk.
Changelog
- 2026-10-06 Data refreshed from the official files.
Keep reading